Here are 10 creative ideas for infographic presentations:
- Storytelling: Use infographics to tell a story. This could be a personal story, a case study, or a narrative that illustrates a trend or phenomenon.
- Comparison: Create infographics that compare two or more concepts or products. This could be a side-by-side comparison or a visual representation of the differences and similarities.
- Timeline: Use infographics to show the history of a topic or industry. This could include milestones, major events, or key players.
- Map: Create a map infographic that illustrates geographic trends, distribution, or demographics.
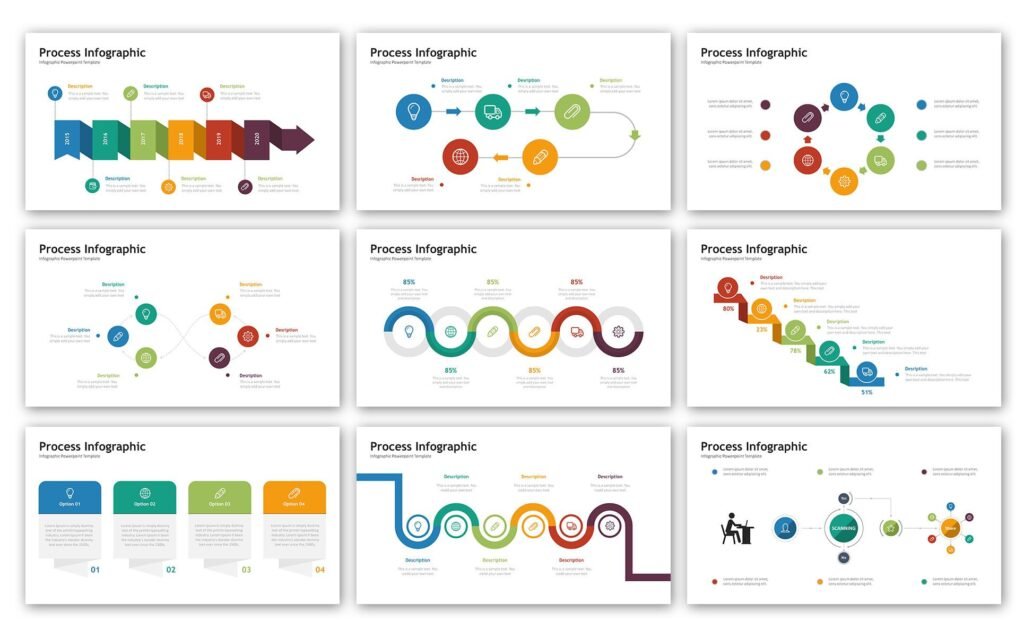
- Process: Use infographics to illustrate a process or workflow. This could include steps, flowcharts, or decision trees.
- Statistics: Use infographics to visualize statistical data, such as demographics, market trends, or survey results.
- Infographic Resume: Create an infographic resume that showcases your skills, experience, and achievements in a visual and engaging way.
- Recipe: Use infographics to create a recipe or food-related infographic that illustrates cooking techniques, nutrition information, or ingredient substitutes.
- How-to Guide: Use infographics to create a how-to guide that explains a complex topic or process in a simple and engaging way.
- Infographic Poster: Create an infographic poster that highlights a social cause, environmental issue, or political topic. This could be used for educational or advocacy purposes.


